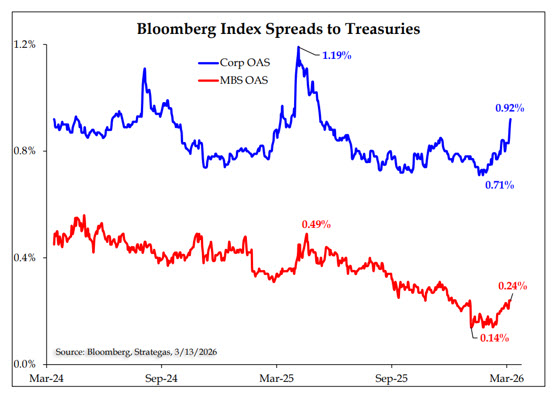
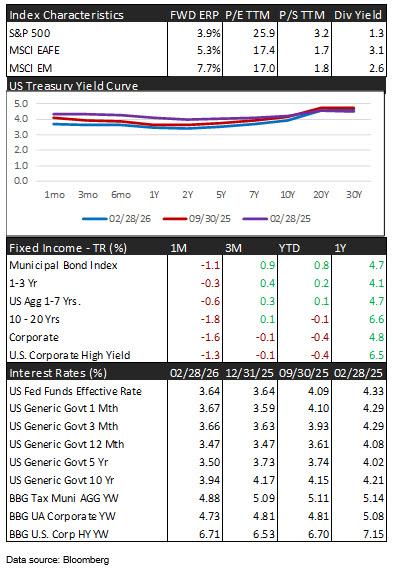
Fixed-income markets over the past month have been affected by changing rate volatility, selective widening of credit spreads, and steady demand for safer assets. Year-to-date performance reflects this balance, with liquidity dynamics playing a key role. Investment-grade corporate spreads have increased to about ninety-two basis points, the highest since last year’s selloff. Meanwhile, mortgage-backed securities have gradually widened as interest rate volatility has risen. Beneath these broad measures, dispersion among issuers and sectors has expanded, indicating a growing gap between stronger and weaker credits, even though overall default risk remains manageable. This pattern of differentiation has recurred, signaling a late-cycle environment in which investors are paying closer attention to credit quality.
The Federal Reserve’s policy continues to prioritize market functioning, reinforcing stability amid recent funding stresses. The Fed reintroduced reserve-management purchases late last year and extended them into early 2026, adding over $38 billion in December and nearly $50 billion in January and February. These operations increased bank reserves to above three trillion dollars and helped reduce volatility in secured funding markets, especially in SOFR, the main overnight lending rate for repurchase agreements. By stabilizing liquidity, the Fed has strengthened the Treasury market’s role as the key anchor of fixed-income pricing, even as broader economic data remains inconsistent. Term premia have stayed flat or declined, highlighting ongoing demand for safe assets despite changing macro conditions.
Credit and funding spreads continue to show a mixed picture. Investment-grade spreads have widened compared to mortgages since late last year, reflecting some softening in corporate valuations. However, the strongest corporate issuers—those whose credit default swaps trade at levels similar to U.S. government debt—remain near multi-year lows, signaling confidence in their top-tier balance sheets. Although equity markets have become more cautious, investment-grade spreads stay below levels that typically indicate recession risk, supporting the view that the recent widening is selective rather than widespread. This pattern of selectivity involves broader differences between sectors and issuers, suggesting that not all companies currently rated investment-grade will maintain that rating if conditions continue to shift.
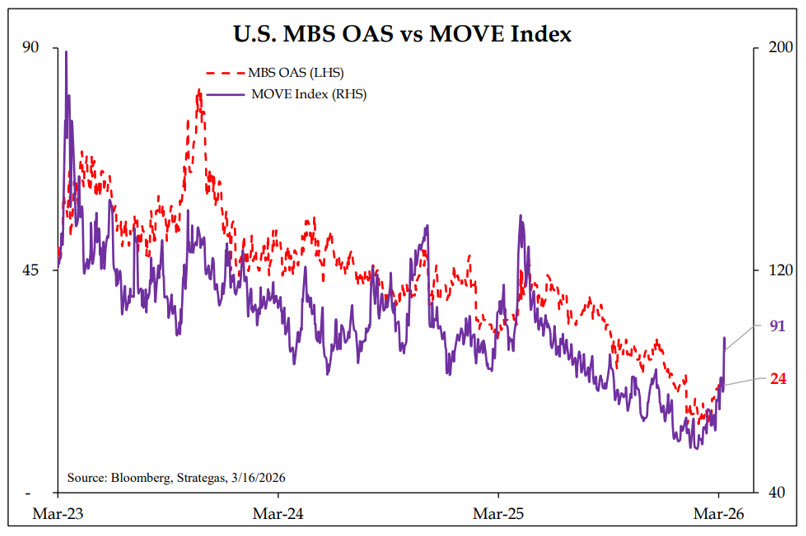
Volatility trends have primarily affected credit and interest rate risk. As interest rate fluctuations increased, mortgage-backed securities experienced their widest option-adjusted spreads since early January, highlighting their sensitivity to rate changes. Historically, short-term increases in spreads caused by shocks have been temporary, and recent changes follow this pattern. In corporate credit, the growing difference between the highest- and lowest-risk issuers underscores the need for careful selection as dispersion expands.
The outlook remains cautious. Ongoing liquidity support and stable term premia should help stabilize Treasury yields. Corporate bonds may continue to vary in performance, making issuer selection more crucial, while mortgage spreads will depend on interest rate stability and market volatility. The broader themes of policy support, a gradual shift toward safer assets, and the increasing gap between strong and weak credits continue to influence fixed-income positioning as the year advances.
Sources: 3Fourteen Research, Strategas Research Partners LLC, and Capital Wars

MARKET HIGHLIGHTS